Vision
A diversity of healthy, liveable and productive landscapes managed sustainably
Introduction
The distinctive and attractive landscape features of north east Victoria, including the diversity of landforms, soils, topography and associated climate, support a variety of land uses and a growing urban population in the region.
The diverse landscapes, fertile valleys, productive agriculture and moderate climate are some of the reasons why people love north east Victoria and why they choose to live and/or visit.
Facts
- Approximately 1.2 million hectares of land is under public land tenure (55% of the region). This is set aside for conservation, recreation and other forest values.
- 2,415 private rural land holdings including agricultural-based enterprises and lifestyle properties.
- Wodonga is one of the top five fastest growing regional cities in Victoria.
- Structural dwellings across the region are forecast to increase by between 9% and 36% between 2016 and 2036 depending on the local government area.
- Many families have a long history of managing land and along with other members of the community are actively involved in stewarding land through a variety of programs and organisations e.g. Landcare.
- For thousands of years, the land has been cared for by Traditional Owners/First Nations Peoples.
- The region contributes approximately $5.55 billion in Gross Regional Product, approximately 6.2% of regional Victoria’s total.[4]
Features
Landforms
The Great Dividing Range is the dominant landform feature, influencing the topography of the region. The region is comprised of two broad landforms, Eastern uplands and Riverine Plains.[5]
Soil
Soil types vary across the region depending on the landform and history. These include texture contrast soils, gradational soils, shallow soils and to a lesser extent, cracking clay soils.
Climate
Relatively moderate climate compared with other parts of the state. Temperatures vary from lows of minus 6°C in the alpine areas to maximums above 38°C in towns and areas outside of the mountains. The region has reliable winter rainfall and mostly dry summers.[6]
Climatic change
Over the past 30 years there has been a decrease in autumn and spring rainfall in the north west and north east parts of the region, with more hot days, especially in the region’s north west. Much of the region is also experiencing later and more frequent frosts than 30 years ago.
Land capability
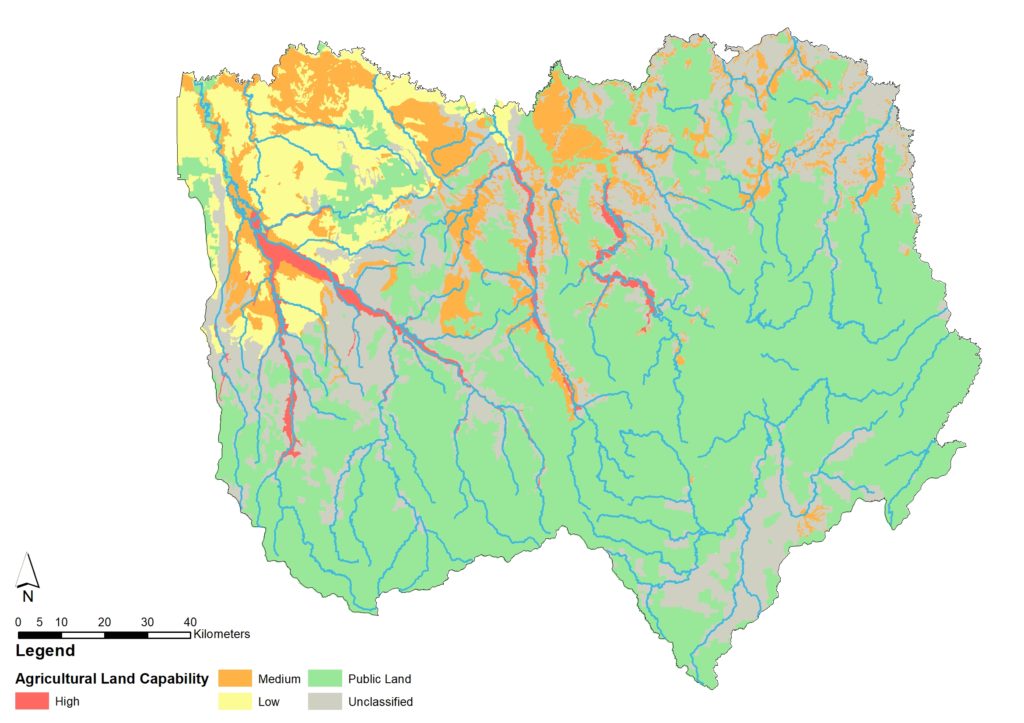
Slope, landform, geology, soil, and climate, combine to determine the capability of land to support different land management without causing significant long-term degradation. Six per cent of freehold land has a high capability for agricultural production and around 55% has moderate capability.[7] The river valleys and wider alluvial plains have higher land capability for agriculture, because of fertile soils and lower slopes.
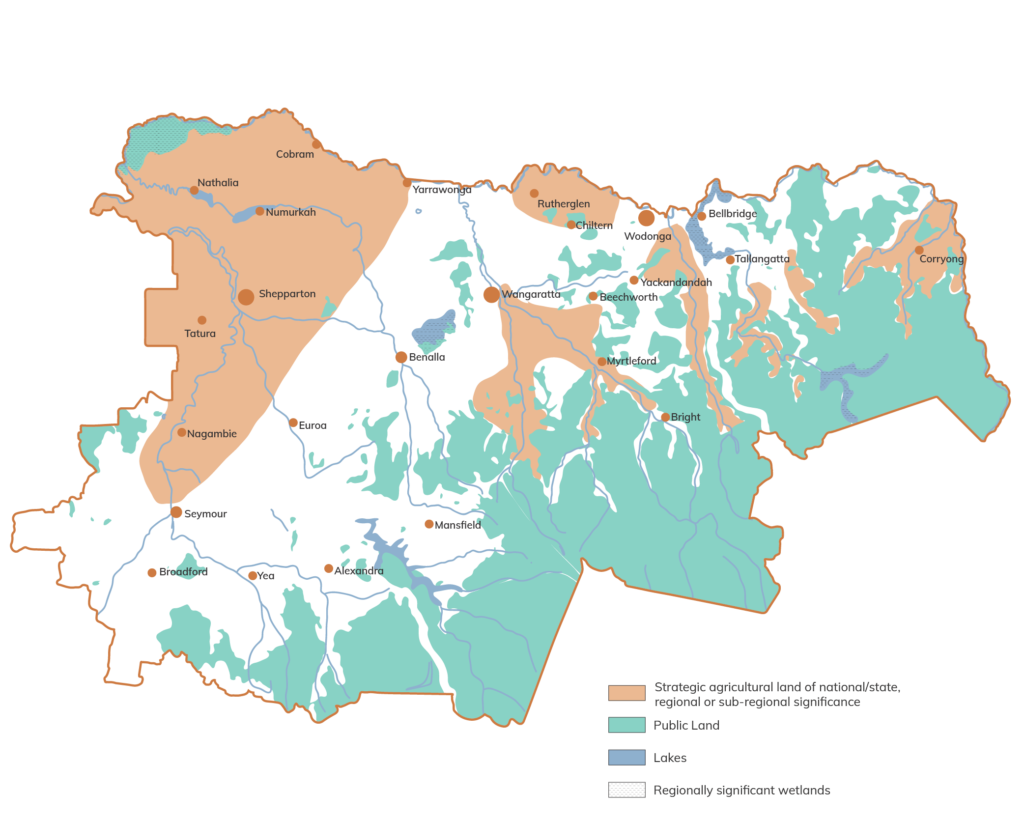
Strategic agricultural areas in the region were identified in the Hume Regional Growth Plan (2014) and include areas defined as having versatility in production, being of significant scale, located in proximity to value-adding processing and having access to secure water supplies.
Cultural landscapes
North east Victoria has a rich and diverse history. The Traditional Owners/First Nations Peoples have strong connection to Country, being the original land managers caring for Country.
Since colonisation, government and others denied the right of Traditional Owners/First Nations Peoples to practice lore, culture and maintain connection to land. While there has been some limited progress in recognition of the rights of Traditional Owner/First Nations Peoples, land tenure and management in the region is still largely based on the Westminster system and detailed in ‘common law’.
‘Australia forms as a tapestry of interwoven cultural landscapes that are the product of the skills, knowledge and activities of Traditional Owner/First Nations Peoples and land managers over thousands of generations. Cultural landscapes are reflections of how Traditional Owner/First Nations Peoples engage with the world and are the planning unit of choice for Traditional Owners.’ [8]
Cultural landscapes are a bridging tool that can be applied to bridge difference between Indigenous and ‘western’ world views. Traditional Owners/First Nations Peoples are seeking decision making authority over the management of traditional territories.
The Victorian Government and Traditional Owners/First Nations Peoples have developed a Traditional Owner Cultural Landscapes Strategy. It presents a framework for how Traditional Owners/First Nations Peoples can lead the planning and management of Country in line with their cultural obligations to care for Country for cultural, environmental and economic benefit.
Land use
Approximately 1.2 million hectares (55%) is under public ownership, managed for conservation. Major regional centres include Wodonga and Wangaratta. There is also a network of towns and villages across the region.
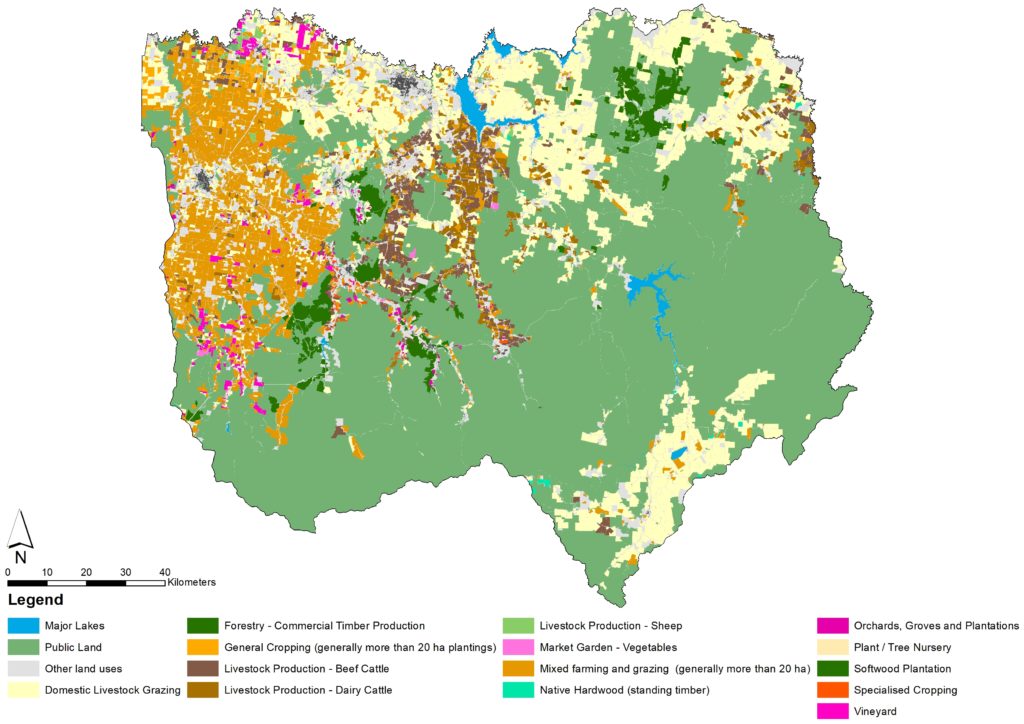
Agricultural uses are dominant on privately owned land (Figure 3) with approximately 650,000 hectares (ha) of land used for agricultural production. Grazing is the most significant agricultural land use, followed by pine plantations.
Important attributes
North east Victoria’s community and visitors interact with land in the region for many reasons and hold shared and varying values, these values are further described in the local landscape sections. The following points describe the important attributes associated with land identified by those who work, live, visit and connect with the region:
- Diversity of landscapes and distinctive topography, that includes rolling hills and valleys riverplains and mountains
- Fertile and stable soils of the valleys, slopes and plains
- Ground cover – native and pasture vegetation cover
- Moderate reliable climate and long growing season
- Traditional Owners/First Nations Peoples caring for Country
- Land managers, a community and active Landcare groups caring for and stewarding land
- Large tracts of public land, reserves and National and State parks.
Snapshot of condition
The section below provides a snapshot of the condition of land in north east Victoria.
For the purpose of this strategy land condition was assessed as being of concern in 2019-20 and declining. This declining trend is apparent in cleared areas. Public managed land is generally in moderate to good condition.

European colonisation and the clearing of land for agriculture, mining and settlement in north east Victoria has had a devastating impact on land and Traditional Owners/First Nations Peoples and Country and continues to do so today.
The current assessment of ‘concerned with a declining trend’ reflects ongoing soil health challenges, due to the legacy of post-colonisation land management and planning practices, combined with recent shocks such as the 2019-20 bushfires and the impacts of climate change.
The condition assessment is informed by a range of indicators that are described further in this section. These include:
- Change in land cover
- Growth
- Agricultural commodities
- Soil health.
Change in land cover
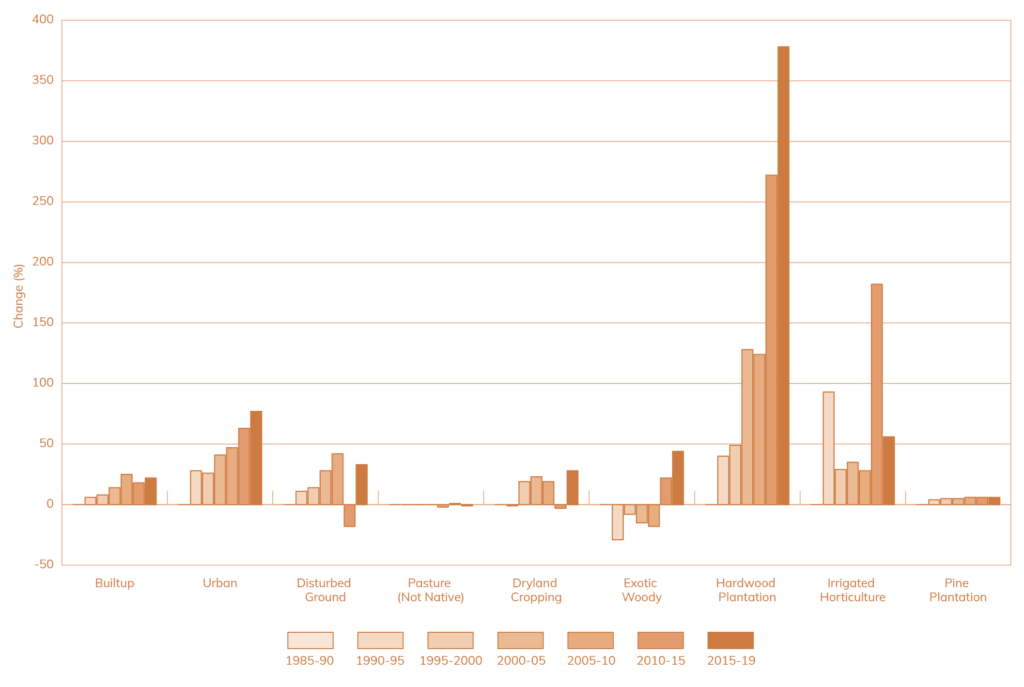
The recently released Victorian Land Cover Time Series estimates changes in land cover for broad land cover classes, including changes in the extent of urban areas and agricultural lands. Although illustrated below, the analysis of change presented in this section does not include native vegetation or wetland areas (Figure 5).
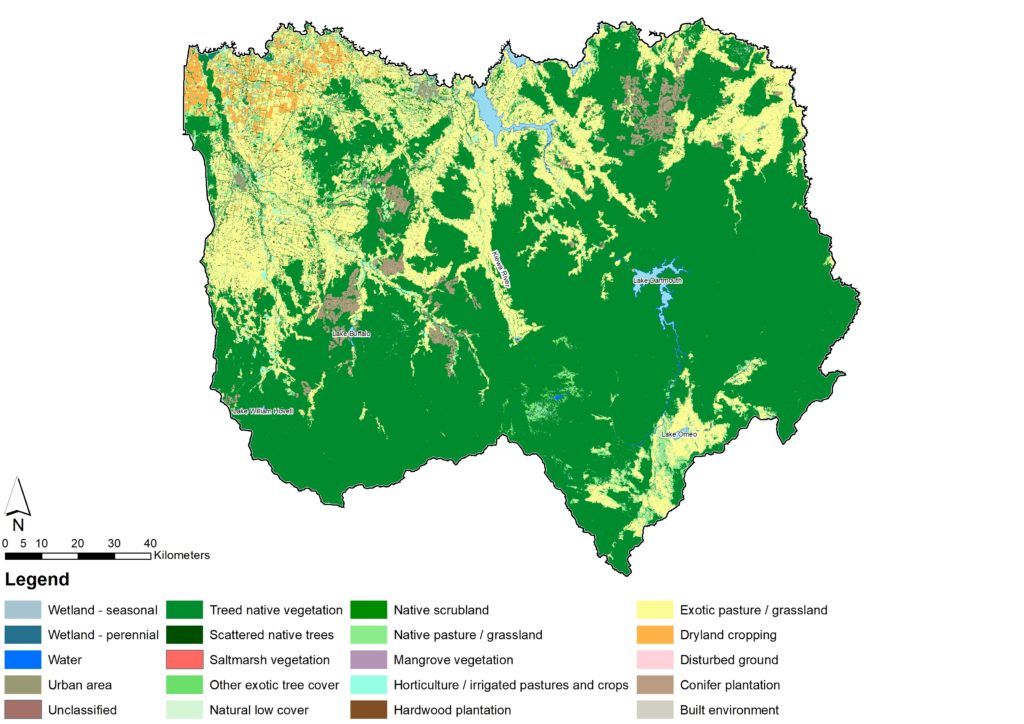
Not including areas of native vegetation and wetlands across the region, over the period between 2015-19, non-native pasture was the dominant land cover in north east Victoria, compromising 79% of the total area (ha) covered among the classes analysed (Table 1).
| Land cover class | 1985-90 | 1990-95 | 1995-2000 | 2000-05 | 2005-10 | 2010-15 | 2015-19 |
|---|---|---|---|---|---|---|---|
| Built-up (ha) | 246 | 260 | 266 | 281 | 307 | 290 | 299 |
| Urban (ha) | 5,208 | 6,691 | 6,584 | 7,357 | 7,636 | 8,493 | 9,194 |
| Disturbed Ground (ha) | 654 | 724 | 747 | 839 | 929 | 536 | 870 |
| Pasture Not Native (ha) | 455,679 | 447,064 | 454,935 | 447,068 | 445,350 | 461,139 | 452,057 |
| Dryland Cropping (ha) | 27,236 | 26,830 | 32,292 | 33,371 | 32,438 | 26,427 | 34,858 |
| Exotic Woody (ha) | 5,509 | 3,908 | 5,076 | 4,672 | 4,512 | 6,740 | 7,920 |
| Hardwood Plantation (ha) | 750 | 1,052 | 1,116 | 1,708 | 1,679 | 2,795 | 3,585 |
| Irrigated Horticulture (ha) | 16,962 | 32,675 | 21,957 | 22,918 | 21,752 | 47,831 | 26,513 |
| Pine Plantation (ha) | 37,438 | 39,093 | 39,381 | 39,324 | 39,393 | 39,504 | 39,793 |
Pine plantations, dryland cropping, and irrigated agriculture are the most common land covers, contributing to another 18% of the total cover. While the remaining accounts for only 3% of land cover, it includes the category with the greatest increase over the past years – hardwood plantation, which boosted production by 250% in the past two decades (Figure 6).
All land cover classes, except non-native pasture, have increased in cover since 1985. Urban cover is the second most significant increase in the north east (77%) since 1985. Built-up cover (22%), which is associated with commercial or industrial development has also increased.
Growth
Population growth has been occurring in north east Victoria over many years.[9]
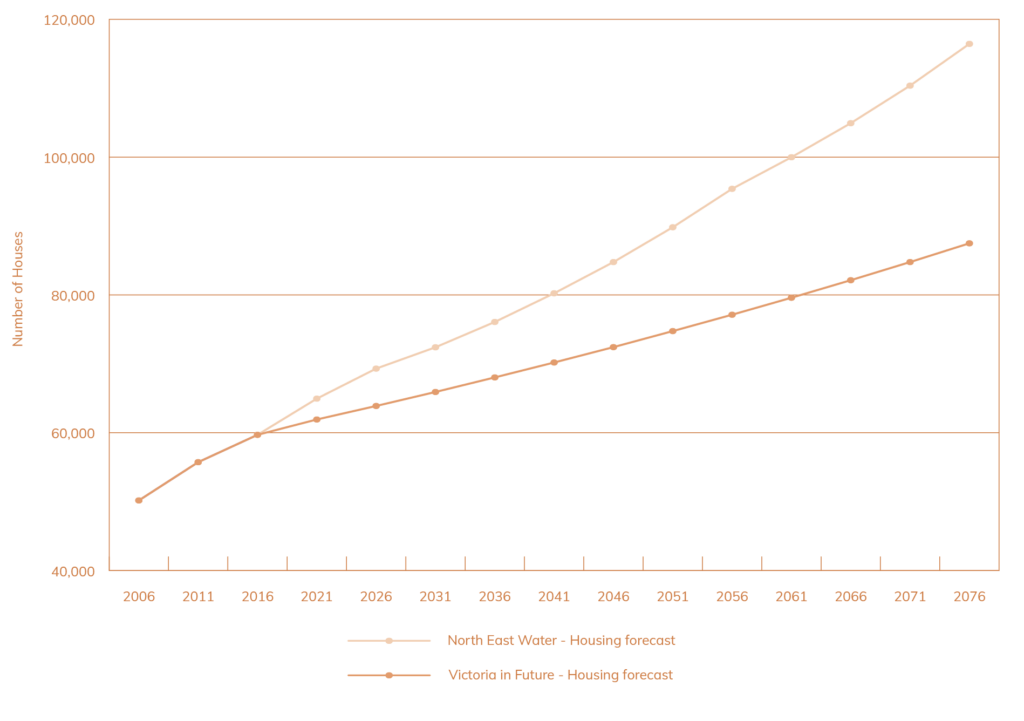
The 2019 Victorian Government report ‘Victoria in Future’ provided projections for population and structural dwelling growth. This report estimated between a 9% and 36% increase in dwellings across the region between 2016 and 2036, dependent on the local government area.[10] Further information on population growth can be found in the Community theme – snapshot of condition.
Many parts of north east Victoria have experienced significantly higher dwelling growth rates than what was predicted in ‘Victoria in Future’. In the past 18 months to the middle of 2021, influenced by coronavirus (COVID-19), growth has further accelerated due to increased migration from capital cities to regional areas. As a result, in some regional centres, the growth projected for the next fifteen years has been realised over the past two years.
To plan for future infrastructure and community water needs, North East Water has developed alternative dwelling projections for parts of the region that are serviced by mains water and sewer. These are based on ABS data, housing water connection data and discussions with local governments. These projections, shown in Figure 7, illustrate potentially higher levels of dwelling growth into the future.
North East Water acknowledges there is uncertainty in the projections, mainly whether the current rapid growth is a ‘step change’ that will eventually level out, or if the last 15 years’ growth rate is the ‘new normal’.
Agricultural commodities
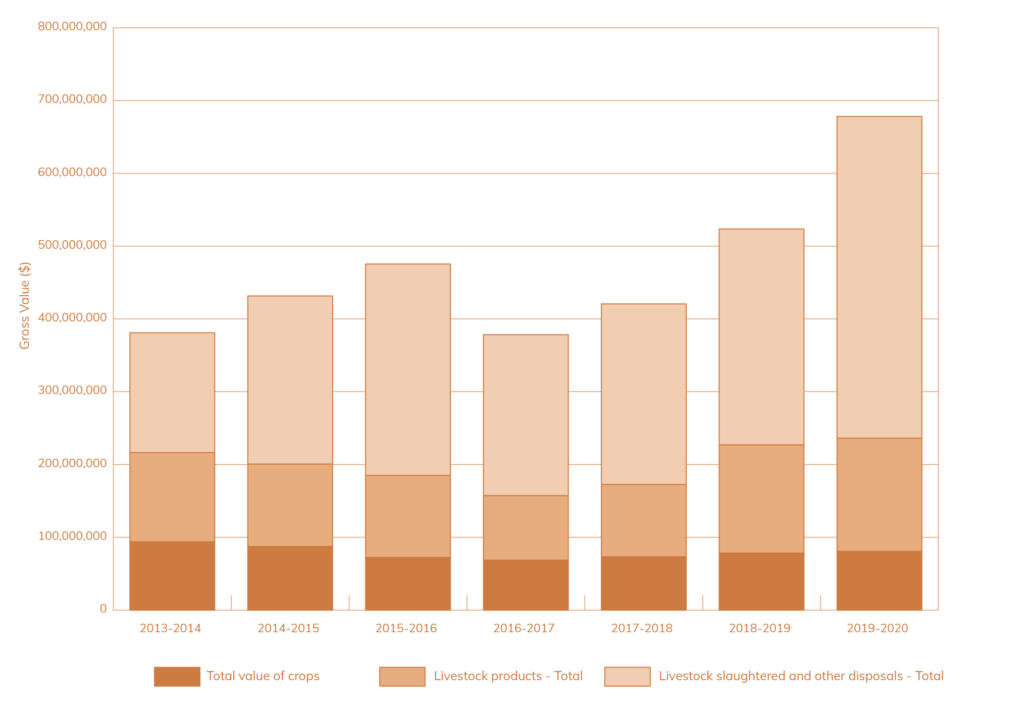
The contribution of agriculture to the regional economy has increased over recent years, with a notable increase in livestock production (Figure 8). In 2019-20:
- Total gross value of agricultural commodities in north east Victoria was more than $678 million (M)[12]
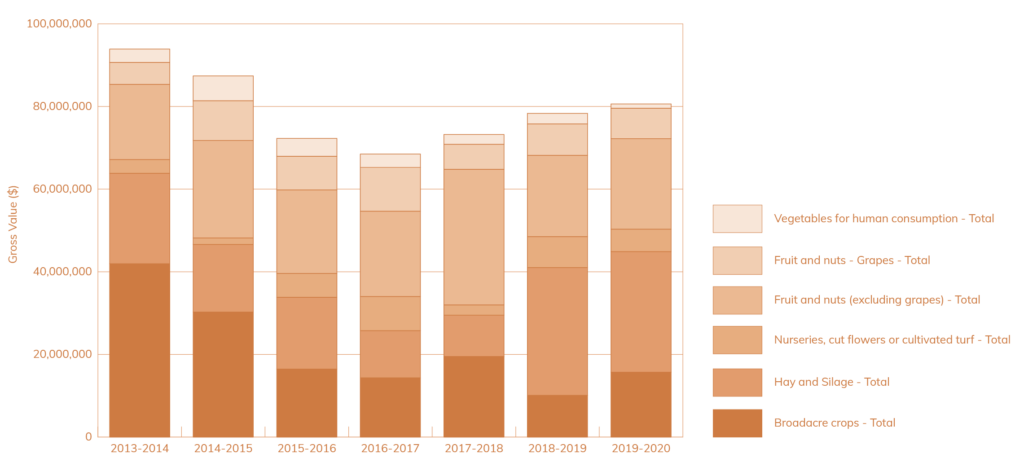
- Gross value of crops was more than $80 M, with fruits and nuts (including grapes) having the greatest contribution, closely followed by hay and silage
- Total gross value of livestock products was more than $155 M, including more than $139 M for milk products
- Livestock slaughtered (meat production) and other disposals was more than $442 M, to which cattle and calves contributed more than $389 M.
The graphs below provide a comparison of agricultural production between 2013-14 and 2019-20.
Soil health
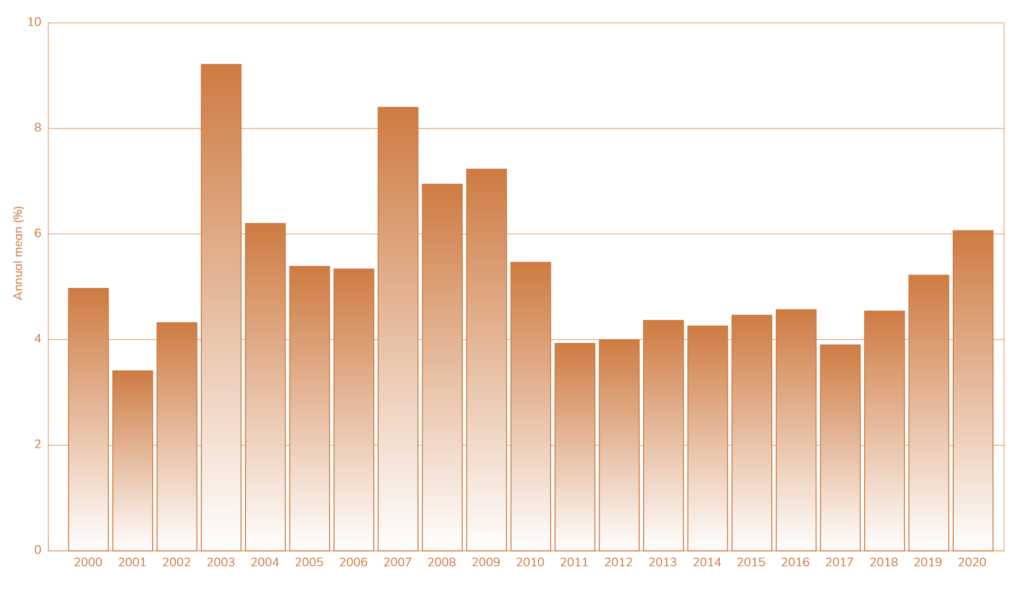
Percentage of exposed soil
Vegetation groundcover is essential for soil health. The percentage of exposed soils in north east Victoria is low in comparison with other regions in Victoria, due to the large percentage of the region that is public land and forested.
Vegetation groundcover varies between seasons, is based on changes in land management and is highly variable between years. In 2019, around 5% of soils in north east Victoria were classified as exposed. Exposed soils have shown an increasing trend over the past three years and are likely to have increased significantly in 2019-20 due to the bushfires.
Soil pH
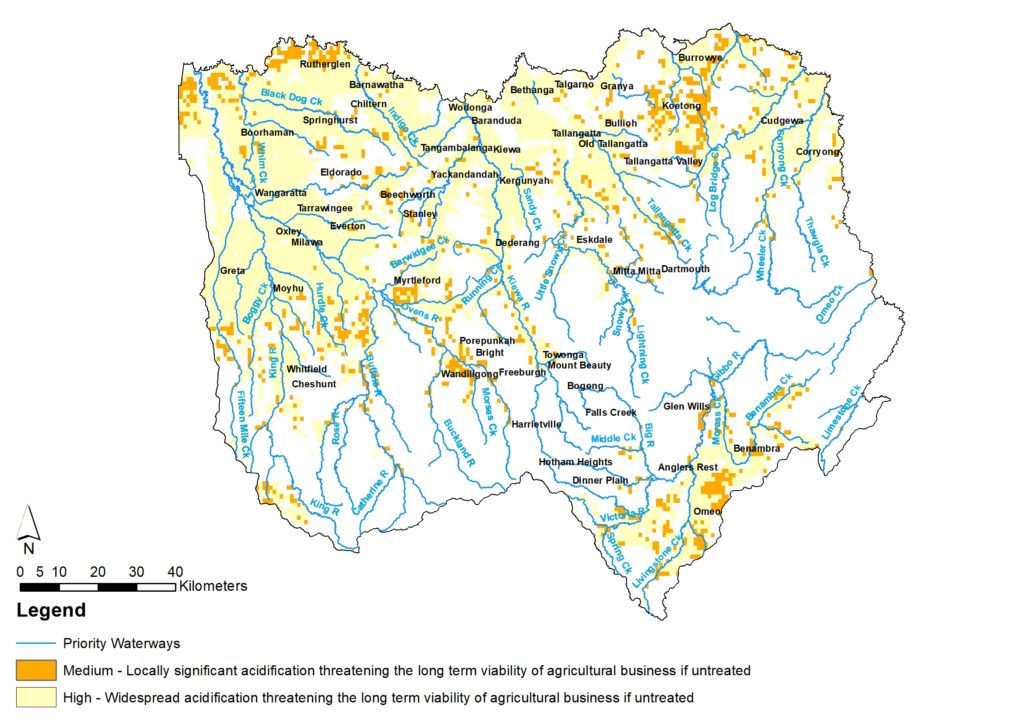
Soil acidification has long been considered a major land degradation issue with widespread occurrences of acidic soils in north east Victoria. A 2004 inquiry into the impacts and trends of soil acidity estimated nearly half of the State’s affected soils are in north east Victoria.[13][14]
The trend is one of declining condition. Soil pH in north east Victoria declined by approximately one pH unit in the 30-40 years following the introduction of modern agricultural practices.[15]
Soil Carbon
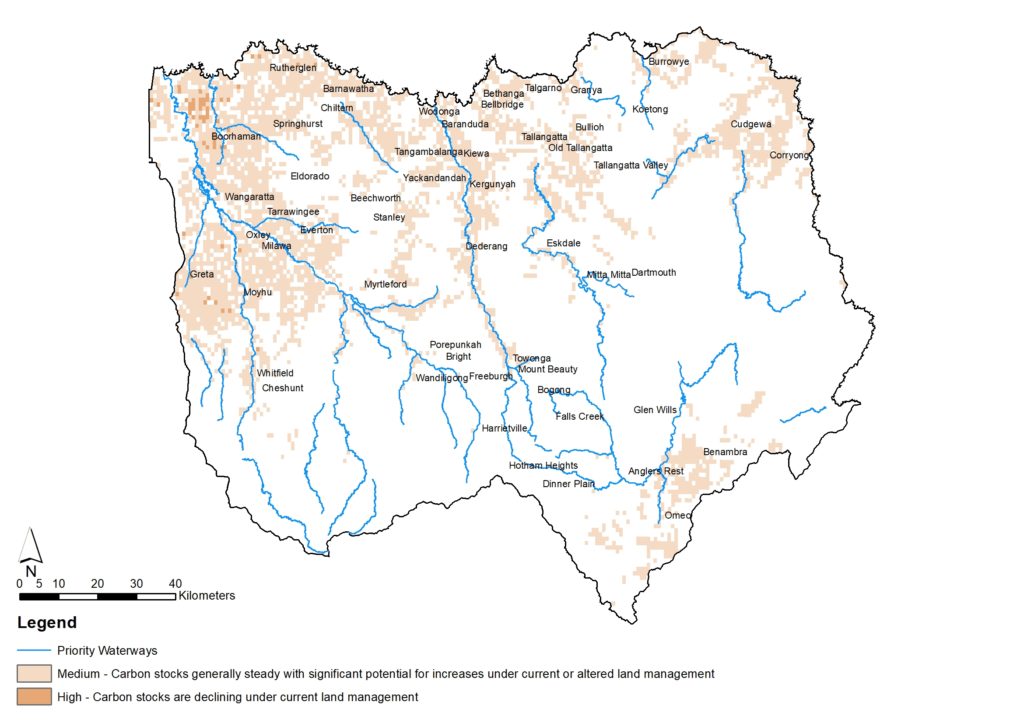
Soil carbon levels within alpine and forested areas of the region are very good. Soil carbon potential ratings have been applied to north east Victoria via the Regional Land Partnerships (RLP) interactive mapping system. The higher the rating the more likelihood that organic matter in soil is declining. The high potential carbon rating is mainly in cropping areas of the region, showing that carbon stocks have declined. The medium rating in main agricultural valleys suggests carbon stocks are steady.[16]
Please note that the ‘snapshot of condition’ section does not incorporate assessments of Healthy Country by Traditional Owners/First Nations Peoples. Throughout the RCS renewal and implementation, we are committed to working with Traditional Owners/First Nations Peoples to restore and protect Traditional Owner/First Nations Peoples’ knowledge systems and to integrate Healthy Country Assessments into monitoring and evaluation processes; acknowledging that traditional ecological knowledge and Indigenous knowledge and practice will be protected under the authority of each Traditional Owner/First nations custodian and group.
What is changing?
The world and our region are changing rapidly and north east Victoria is more interconnected across multiple spatial scales than ever before. Across north east Victoria this is leading to a range of changes, opportunities and challenges for managing land as outlined in the table below.
The table describes some of the major drivers of change and what this means for land in north east Victoria.
| Driver of change | Leading to |
|---|---|
| Climate change | Increase in temperature across all seasons and increase in number of extreme hot days and frosts impacting on agricultural productivity. Some commodities may struggle to have their temperature requirements met for production. Changes to the range and rate of spread of pest plants and animals. Soil health problems such as erosion will be exacerbated and it will be increasingly difficult to maintain groundcover. Increase in both the frequency and intensity of extreme weather events including flood, fire and drought. Potential for reduced growing season, impacting on agricultural productivity. Opportunity for improved land management and improved monitoring of land and soil condition. Potential for increased plant production in some areas, especially for summer active pasture species that are heat and drought tolerant. |
| Changing land ownership, land use and demographics | Rapid population growth and increased migration into the region from major cities. Uncertainty around levels of population and development growth in the region due to modeling being exceeded, resulting in difficulties planning for growth. Increase in demand for land for urban, rural residential and lifestyle uses, increasing land values and housing prices. Reduction in available land for agricultural production, impacting on strategic agricultural land, biodiversity and amenity values. Intensification of farming systems. Changing demographics and landholders new to land management. Communities experiencing increased ‘tree change’ migration and seeing an increased interest in sustainable land management and re-invigorated communities. New land tensions between adjacent land uses e.g. renewable energy developments that act to mitigate climate change, resulting in loss of agricultural land. Greater use of public land and demand for recreation activities. |
| Increase in pest plants and animals | Increase in number and range of pest plant and animal species. Trampling and browsing activities in particular affect soil stability and agricultural productivity. Impacts on agricultural productivity through competition with agricultural crops. Opportunity for large-scale joint programs and variety of techniques to manage pest plants and animals across landscapes e.g. bio-controls. |
| Technological innovation | New and rapidly advancing technology for agricultural practices and monitoring. For example, the use of drone photography, GIS and remote management systems, mobile applications and virtual fencing. Agricultural innovation is leading to farm expansion, as well as intensification – impacting on vegetation cover and stocking rates. Increased reliance on technology facilitating growth in corporate agriculture and increase in farm property size and reducing labour needs. New technologies reducing costs, improving product quality and supply chain efficiency. |
| Changing markets and commodities | New industries are emerging. Change in consumer preferences supporting small scale farmers selling at local farmers markets and cooperatives. With this comes a change in primary production, land use and moves to more intense and specialty farming. Energy scarcity and emerging markets for renewable energy, e.g. solar and wind. Ongoing demand for minerals and exploration for mineral deposits. |
| Increasing role and recognition of Traditional Owners/First Nations Peoples | Government policy and legislative changes formalising rights to self-determination, co-management arrangements and Traditional Owner/First Nations Peoples involvement in land management. Increasing occurrence of co-management of public land between Traditional Owners/First Nations Peoples and government agencies. Opportunity to integrate cultural practices, Traditional Ecological Knowledge and objectives into land management, where permission is granted. |
Resilience insights
The changes described above directly impact the land system in north east Victoria.
To build the resilience of land we need to understand if these changes are strengthening or reducing the resilience of land and thresholds. Thresholds are known limits for characteristics of land that, if reached, trigger a change in land and its important attributes.
Often thresholds are based on western science and quantitative data. Thresholds in this strategy include consideration of available science, data, traditional ecological knowledge and community knowledge.
In many cases, there is insufficient knowledge or data to determine thresholds. We will continue to work to build understanding and knowledge of thresholds during the life of the RCS. Consideration of these thresholds will be considered in the development of the detailed monitoring and evaluation plan for the strategy.
| Factors strengthening resilience | Factors reducing resilience | Thresholds (Point if reached the system will change from its current state) |
|---|---|---|
| Diversity of productive landscapes and farming systems support adaptation to changing climate and markets. Programs provide mechanisms to support organisations, individuals, and land managers, at all levels and scales, to manage soil and land effectively. Cross sector forums and partnerships across NRM organisations, industry and the community. Landholders and managers open to and adopting practices to accommodate climate change. Management of land within capability. Investments and uptake of technology e.g. modernised irrigation systems. Large amounts of land in parks and reserves, managed for conservation providing good vegetation cover. Landholders and managers practicing catchment stewardship and considering integrated catchment management. Traditional Owner/First Nations Peoples healing knowledge and country and increasingly involved in managing and governing country. | Small-scale of some farms impacting on ability to compete and remain viable. Drive for agricultural efficiency can result in reduced ability to adapt and contribute to NRM. Intensification of agriculture. High land prices and competition for land is reducing the ability of some farms to expand. Climate variability with more frequent extreme weather events impacting on soil health. Ongoing land planning and management practices which degrade soils, such as land clearing, over-grazing and grazing on steep slopes. Poor soils health, including soil acidification. Removal of vegetation through land use change. Climate change may make it difficult to maintain groundcover. | pH: 5.5 – 7 for most agricultural crops and native vegetation. Vegetation – groundcover of 50% to reduce wind erosion and 70% to up 100% to reduce water erosion. Vegetated groundcover not recovering between one extreme event and the next, increasing erosion risk. Land managed within its capability. Urbanisation rate >5% on high value agricultural land Directly connected impervious (DCI) area > 2% in urban areas. |
Outcomes and priority directions
Vision (by 2050)
A diversity of healthy, liveable and productive landscapes managed sustainably.
The table below describes the course we will take to move towards our vision for land by providing:
Long-term outcome – these describe where we want to be in 20 years
Medium-term outcomes – these describe what we are currently doing and where we want to be in six years and help us to measure success in moving towards our vision and long-term outcomes
Established priority directions – what we are currently doing and want to continue to do over the next six years. They will help us build resilience in the face of change. Many of these directions are about persisting and adapting to change.
Pathway priority directions – ways forward over the next six years, that are not currently common practice in the region. They will help us adapt to change and are bridging activities between the current way of doing things and moving to a fundamental change.
Transforming priority directions – new practices that create a new way of doing things, that will be investigated, and where feasible implemented over the next six years or outside the lifetime of this RCS.
We will implement all three priority directions, Existing, Pathway and Transforming, to achieve our vision.
It is recognised there is a need for a shift in current approaches to planning and management paradigms, so that Traditional Owners/First Nations Peoples can heal Country and culture, through the application of cultural knowledge and practice. This will take time. Traditional Owners/First Nations Peoples will guide this process and where requested by the Traditional Owners Strategic Framework for Managing Country outlined in the Victorian Traditional Owners Cultural Landscapes Strategy.
1. By 2040 north east Victoria has improved soil health and supports a diversity of profitable industries that are sustainably managing land
| Medium-term outcomes | Established priority directions | Pathway priority directions | Transforming priority directions |
|---|---|---|---|
| 1.1 By 2025, appropriate amendments are made in local planning schemes to include provisions and targets for protecting of strategic agricultural land. | 1.7 Extension, promotion and support to improve land manager understanding and capacity to adopt best practice soil management. | 1.14 Identification of priority areas where changes in soil health can considerably increase agricultural productivity or environmental outcomes in north east Victoria. | 1.20 Support for innovative and best practice solutions that improve soil health. |
| 1.2 By 2027, annual mean percentage of exposed soil, unprotected by living vegetation or litter is below 5%. 1.3 By 2027, soil acidification risk has decreased and soil pH is within acceptable levels for most agricultural crops and native vegetation. | 1.8 Promotion of activities that improve groundcover to reduce exposure of soil to wind and water erosion e.g. minimum tillage, shelter belts, native vegetation retention, native pastures. 1.9 On-farm biodiversity protection and improvement programs including covenants, management agreements, Landcare and individual initiatives. | 1.15 Understanding the capacity of our soils and the management techniques to increase soil carbon. 1.16 Land managers in north east Victoria understand the value of soil to production and the environment and management techniques required to improve soil health. | 1.21 All private landholders valuing soil and biodiversity for the ecosystem functions it provides and implementing activities to protect. 1.22 Markets created for the commercial sale of pest animal products, such as commercial deer and other pest species. |
| 1.4 By 2027, soil carbon levels have been maintained across north east Victoria. 1.5 By 2027, there is increased awareness and adoption of land management practices that improve and protect the condition of soil. 1.6 By 2027, there is an increase in hectares (ha) of pest plant and animal management for land productivity and biodiversity. | 1.10 Land managers are supported to undertake condition assessments of their properties e.g. soil testing, pasture assessments and farm assessments to improve land management. 1.11 Land managers working in partnership with agencies and other land managers to control the impact of pest plants and animals on productivity and biodiversity. 1.12 Strategic updates to planning policies and planning controls to improve the protection of strategic agricultural land and high value and at-risk land and soil resources. 1.13 Local governments and referral authorities supported to ensure growth and development in urban and peri-urban areas is sustainable, through cross industry forums and collaborations. | 1.17 Understanding the best future opportunities to maintain diversity for industry and agriculture in the region. 1.18 Ongoing research to understand the benefits and impacts of management techniques such as biodynamic, organic and emerging regenerative agriculture practices. 1.19 Mapping and other tools available to provide information to local government and other authorities on land capability and high value agricultural land in planning decisions. | 1.23 Protect areas of strategic and high value agricultural land within the region. |
2. By 2040, land management practices are culturally appropriate reflecting Traditional Owners/First Nations Peoples cultural objectives
| Medium-term outcomes | Established priority directions | Pathway priority directions | Transforming priority directions |
|---|---|---|---|
| 2.1 By 2027, there is an increase in collaboration with Traditional Owners/First Nations Peoples to raise awareness and implement culturally appropriate land management practices to support and improve land, biodiversity, water and cultural values | 2.2 Traditional Owners/First Nations Peoples rights are recognised and applied in conservation and land management practices on Country. 2.3 Raise awareness of cultural heritage requirements in agricultural settings. | 2.4 Traditional Owners/First Nations Peoples and agricultural land managers working together to share knowledge and manage land. 2.5 Integrate Reading Country Assessments into land management planning that embeds cultural landscape value | 2.6 Traditional Owners/First Nations Peoples conservation and land management practices are recognised and applied on Country. 2.7 Partnerships between Traditional Owners/First Nations Peoples, community, private and public sectors deliver the region’s land management programs. 2.8 Integration of Traditional Owners/First Nations Peoples’ cultural landscapes and reserve management and Indigenous Protected Areas. 2.9 Culturally important places on private land are protected and jointly managed by private landholders and Traditional Owners/First Nations Peoples through cultural and conservation covenants or agreements. |
3. By 2040 community resilience and land management practices are continually adapting to accommodate challenges of climate change and extreme events
| Medium-term outcomes | Established priority directions | Pathway priority directions | Transforming priority directions |
|---|---|---|---|
| 3.1 By 2027, the capacity of communities to respond to climate change and extreme events has increased through skill development programs that consider climate change risk and resilience leadership. | 3.4 Government agencies working closely with communities to prepare for and recover from natural disasters. | 3.12 Identify and support programs to improve understanding of opportunities to manage and sequester carbon with co-benefits for land and biodiversity. | 3.15 Sequestering and managing carbon is an integral part of all land management providing co-benefits for land and biodiversity. |
| 3.2 By 2027, land managers have changed practices to adapt to climate change. 3.3 By 2027, Traditional Owners/First Nations groups are recognised in incident control management and have the capacity to respond to extreme events on their Country. | 3.5 Delivery of community leadership programs that support increased understanding of climate risks and build community capacity to respond to extreme events. 3.6 Land managers supported to understand how climate change influences production and commodity types. | 3.13 Urban greenspace planting and rural shade and shelter for a changing climate across north east Victoria. 3.14 Traditional Owners/First Nations Peoples have resources in place to respond to extreme events. | 3.16 Partnerships between community, private and public sectors deliver adaptive land management programs within the region. |
| 3.7 Agricultural industries supported to plan for climate change adaptation and extreme events. 3.8 Regulations and controls in place to prevent new development in areas at risk of flooding and fire. 3.9 Extension, support and funding programs in place for land managers for drought resilience and emergency management planning. 3.10 Floodplain modeling completed to understand and plan for flood risks to communities under climate change. 3.11 Explore options for land managers to enter the carbon trading market using approaches that have land and biodiversity co-benefits. |

